
Page 85 - 2015 Compass Now
P. 85
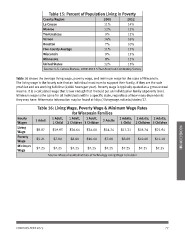
Table 15: Percent of Population Living in Poverty

         County/Region                             2000      2012

         La Crosse                                 11%       14%

         Monroe                                    12%       15%

         Trempealeau                               9% 12%

         Vernon                                    14%       16%

         Houston                                   7% 10%

         Five-County Average                       11%       13%

         Wisconsin                                 9% 13%

         Minnesota                                 8% 11%

         United States                             12%       15%

                  Source: U.S. Census Bureau, 2009-2013 5-Year American Community Survey

Table 16 shows the average living wage, poverty wage, and minimum wage for the state of Wisconsin.
The living wage is the hourly rate that an individual must earn to support their family, if they are the sole
provider and are working full-time (2,080 hours per year). Poverty wage is typically quoted as a gross annual
income. It is a calculated wage that is low enough that it would put an individual or family at poverty level.
Minimum wage is the same for all individuals within a specific state, regardless of how many dependents
they may have. Minnesota information may be found at http://livingwage.mit.edu/states/27.

         Table 16: Living Wage, Poverty Wage & Minimum Wage Rates

                              for Wisconsin Families

Hourly   1 Adult  1 Adult,   1 Adult, 1 Adult,     2 Adults  2 Adults, 2 Adults, 2 Adults,
Wages             1 Child   2 Children 3 Children             1 Child 2 Children 3 Children

Living   $8.87 $19.95 $26.64 $34.60 $14.24 $17.31 $18.74 $21.94                                                 INCOME/ECONOMIC
Wage
         $5.21    $7.00     $8.80 $10.60 $7.00               $8.80 $10.60 $12.40
Poverty
Wage     $7.25    $7.25     $7.25  $7.25           $7.25     $7.25                      $7.25  $7.25

Minimum
Wage

                  Source: Massachusetts Institute of Technology Living Wage Calculator

COMPASS NOW 2015                                                                                      77