Page 88 - 2015 Compass Now
P. 88

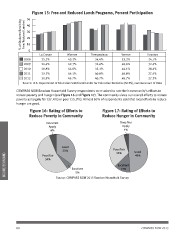
Figure 15: Free and Reduced Lunch Programs, Percent Participation

                 % of Students Receiving  50
                    Free/Reduced Lunches
                                          40

                                          30

                                          20

                                          10

                                          0                    Monroe           Trempealeau  Vernon                    Houston
                                                    La Crosse

                 2008                         25.1%            40.2%            34.4%        33.2%                     24.7%

                 2009                         26.4%            42.3%            32.6%        40.6%                     32.4%

                 2010                         28.8%            43.8%            35.3%        44.1%                     28.4%

                 2011                         29.7%            46.1%            40.8%        40.8%                     27.6%

                 2012                         30.9%            46.7%            40.7%        40.7%                     27.3%

                 Source: U.S. Department of Education’s National Center for Education Statistics (NCES), Common Core of Data

                 COMPASS NOW Random Household Survey respondents were asked to rate their community’s efforts to
                 reduce poverty and hunger (see Figure 16 and Figure 17). The community views our overall efforts to reduce
                 poverty as largely fair (37.4%) or poor (15.9%). Almost 50% of respondents said that local efforts to reduce
                 hunger are good.

                                          Figure 16: Rating of Efforts to       Figure 17: Rating of Efforts to
                                          Reduce Poverty in Community           Reduce Hunger in Community

                                              Does Not                                       Does Not
                                                Apply                                          Apply
                                                 6%                                             4%

                                                               Good                          Poor/Fair           Good
                                                               35%                             33%               49%

INCOME/ECONOMIC                               Poor/Fair
                                                54%

                                                                     Excellent               Excellent
                                                                        5%                     14%

                                                               Source: COMPASS NOW 2015 Random Household Survey

                 80 COMPASS NOW 2015
   83   84   85   86   87   88   89   90   91   92   93