Page 80 - 2015 Compass Now
P. 80

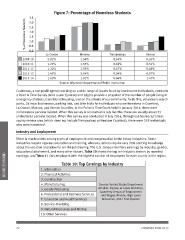
Figure 7: Percentage of Homeless Students

                 % of Homeless Students      3.5
                                             3.0
                                             2.5  La Crosse                Monroe        Trempealeau                            Vernon
                                             2.0                                                                                0.53%
                                             1.5  0.92%                    2.56%         0.64%                                  0.51%
                                             1.0                                                                                0.89%
                                             0.5  1.29%                    2.55%         0.69%                                  0.97%
                                             0.0                                                                                1.47%
                                                  1.20%                    2.95%         0.67%
                                       2009-10
                                       2010-11    1.49%                    3.04%         0.94%
                                       2011-12
                                       2012-13    1.63%                    2.91%         0.86%
                                       2013-14

                                                             Source: Wisconsin Department of Public Instruction

INCOME/ECONOMIC  Couleecap, a non-profit agency working on a wide range of issues faced by low-income individuals, conducts
                 a Point in Time Survey twice a year (January and July) to provide a snapshot of the number of people living in
                 emergency shelters, transitional housing, and on the streets of our community. To do this, volunteers search
                 parks, 24-hour businesses, parking lots, and bike trails for individuals who are homeless in Crawford,
                 La Crosse, Monroe, and Vernon Counties. In the Point in Time Count held in January 2014, there were
                 no homeless persons located. When this survey is conducted in July months, there are usually about 25
                 unsheltered persons located. When this survey was conducted in July 2014, throughout Couleecap’s four-
                 county service area (which does not include Trempealeau or Houston Counties), there were 378 individuals
                 who were homeless9.

                 Industry and Employment

                 There is much variety among types of employment and compensation in the below industries. Some
                 industries require rigorous education and training, whereas, others require very little starting knowledge
                 about the vocation and allow for on-the-job training. The U.S. Census monitors earnings by industry, gender,
                 educational attainment, and many other factors. Table 10 shows the top ten industry sectors by reported
                 earnings, and Table 11 lists employers with the highest number of employees for each county in the region.

                                                                  Table 10: Top Earnings by Industry

                                                  1. Information

                                                  2. Financial Activities

                                                  3. Construction

                                                  4. Manufacturing                        Source: United States Department
                                                  5. Goods-Producing                     of Labor, Bureau of Labor Statistics,
                                                  6. Professional and Business Services
                                                  7. Education and Health Services        Quarterly Census of Employment
                                                                                            and Wages, Private, High-Level
                                                                                            Industries, 2014 First Quarter

                                                  8. Service-Providing

                                                  9. Natural Resources and Mining

                                                  10. Other Services

                 72 COMPASS NOW 2015
   75   76   77   78   79   80   81   82   83   84   85