
Page 86 - 2015 Compass Now
P. 86
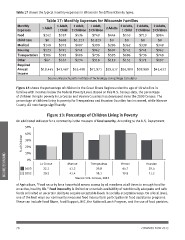
Table 17 shows the typical monthly expenses in Wisconsin for different family types.

                                      Table 17: Monthly Expenses for Wisconsin Families

Monthly                               1 Adult    1 Adult,   1 Adult,    1 Adult,   2 Adults  2 Adults,  2 Adults,   2 Adults,
Expenses                                         1 Child   2 Children  3 Children             1 Child   2 Children  3 Children

Food                                  $242 $357            $536        $749         $444 $553               $713       $904
                                                                                                                        $0
Child Care                            $0         $638 $1,223 $1,829                   $0     $0             $0
                                                                                                                       $349
Medical                               $140 $375            $407        $390         $296 $362               $339       $962
                                                                                                                       $748
Housing                               $523 $741            $741        $962         $607 $741               $741       $197

Transportation                        $306 $595            $686        $736         $595 $686               $736    $45,632

Other                                 $67 $167 $234                    $318         $119 $151               $171

Required                              $18,445 $41,487 $55,408 $71,971 $29,617 $36,000 $38,989
Annual
Income

                                      Source: Massachusetts Institute of Technology-Living Wage Calculator

Figure 13 shows the percentage of children in the Great Rivers Region under the age of 18 who live in
families with incomes below the Federal Poverty Level. Based on this U.S. Census data, the percentage
of children living in poverty in La Crosse and Vernon Counties has decreased since the 2000 Census. The
percentage of children living in poverty for Trempealeau and Houston Counties has increased, while Monroe
County did not change significantly.

                      Figure 13: Percentage of Children Living in Poverty

An additional indicator for a community is the measure of food security. According to the U.S. Department

                                50%

INCOME/ECONOMIC                 40%

                 % of Children  30%

                                20%

                                10%

                                  0%  La Crosse  Monroe                Trempealeau           Vernon             Houston
                                         22.1                                                 44.7                29.4
                                2000     20.2              41.2 29.8                          39.8                31.2
                                2012
                                                           41.4 38.1

                                                           Source: U.S. Census, 2012

of Agriculture, “Food security for a household means access by all members at all times to enough food for
an active, healthy life.” Food insecurity is limited or uncertain availability of nutritionally adequate and safe
foods or limited or uncertain ability to acquire acceptable foods in socially acceptable ways. On a local level,
one of the best ways our community measures food insecurity is participation in food assistance programs.
These can include Food Share, Food Support, WIC, the National Lunch Program, and the use of food pantries.

78 COMPASS NOW 2015