
Page 87 - 2015 Compass Now
P. 87
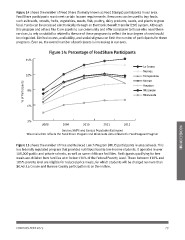
Figure 14 shows the number of Food Share (formally known as Food Stamps) participants in our area.
FoodShare participants must meet certain income requirements. Resources can be used to buy foods
such as breads, cereals, fruits, vegetables, meats, fish, poultry, dairy products, seeds, and plants to grow
food. Funds can be accessed electronically through an Electronic Benefit Transfer (EBT) system. Although
this program and others like it are assets to our community and offer assistance to those who need these
services, to rely on statistics related to the use of these programs to reflect the true degree of need would
be misguided. Limited access, availability, and social stigmas can limit the number of participants for these
programs. Even so, the overall number of participants is increasing in our area.
Figure 14: Percentage of FoodShare Participants
15%
La Crosse
12% Monroe
Trempealeau
% of Participants Vernon
Houston
9% Wisconsin
Minnesota
6%
3% 2009 2010 2011 2012 INCOME/ECONOMIC
2008
Source: SAIPE and Census Population Estimates
Wisconsin data reflects the Food Share Program and Minnesota data reflects the Food Support Program
Figure 15 shows the number of Free and Reduced Lunch Program (FRLP) participants in area schools. This
is a federally regulated program that provides nutritious food to low-income students. It operates in over
100,000 public and private schools, as well as some childcare facilities. Participants qualifying for free
meals are children from families at or below 130% of the Federal Poverty Level. Those between 130% and
185% poverty level are eligible for reduced-price meals, for which students will be charged no more than
$0.40. La Crosse and Monroe County participation is on the incline.
COMPASS NOW 2015 79