
Page 52 - 2015 Compass Now
P. 52
Screening and assessment in early childcare environments can provide critical information to parents,
caregivers and educators that can lead to identification, early intervention and improved outcomes for
children, which allows teachers to teach more effectively and children to learn more successfully. Screening
and assessment give teachers and parents a starting point for the child that makes it easier to measure how
a student is progressing, if they are on track, or if they need extra help in certain areas. Programs such as
birth-to-three are federally funded and mandated to provide services for children identified with disabilities
and to coordinate with school districts for continuity and education planning. Although there are a number of
early learning programs in the Great Rivers Region, one survey found that the use of developmental screening
and assessment was inconsistent, and that barriers to assessment included lack of time, training, and
assessment tools8.
What one considers to be key indicators for school readiness may vary greatly among parents, school
districts, and states. Head Start defines school readiness as “children possessing the skills, knowledge,
and attitudes necessary for success in school and later life learning.” In 2007, Child Trends Data Bank’s
report Early School Readiness: Indicators on Children and Youth emphasized that school readiness is a
multi-dimensional concept and that children who enter school with early skills, such as basic knowledge of
math and reading, are more likely than their peers to experience later academic success, attain high levels of
education, and secure employment11. The National Education Goals Panel conceptualizes school readiness in
five dimensions: physical well-being and motor development, social and emotional development, approaches
to learning, language development (including early literacy), and cognition and general knowledge11. Table
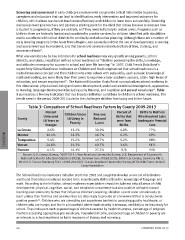
3 summarizes a few key indicators that in a broader definition contribute to children’s school readiness. The
trends seen in the period 2008-2012 point to the challenges children face today and in the future.
Table 3: Comparison of School Readiness Factors by County 2009-2013
County Percent Children Under Free and Percent of Births to Mothers
Uninsured 18 Living in Reduced Births that Who Received Late/
18 Years or Poverty were Teen Inadequate Prenatal
Younger Lunch
Births Care
La Crosse 2.6% 13.2% 30.9% 4.8% 77%
EDUCATION Monroe 14.4% 22.3% 46.7% 6.2% 69%
Trempealeau 9.4% 19.2% 40.7% 5.2% 68%
Vernon 24.8% 21.3% 40.7% 3.6% 51%
Houston 4.1% 16.1% 27.3% N/A N/A
Source: U.S. Census Bureau, 2009-2013 5-Year American Community Survey; U.S. Department of Education’s
National Center for Education Statistics (NCES), Common Core of Data (CCD); 2000 U.S. Census, Summary File 3;
2010 U.S. Census Summary File 1; 2008-2012 U.S. Census American Community Survey (ACS); Kids Count, Annie E.
Casey Foundation
The School Readiness Indicators Initiative started in 2005 and sought to develop a core set of indicators
and found that school readiness needed to be more broadly defined than the knowledge of language and
math. According to the Initiative, school readiness expectations should include not only all areas of child
development: physical, cognitive, social, and emotional competence but also positive attitudes toward
learning and community factors that influence children’s learning. Children cannot enter school ready to
learn unless their families and communities are also ready to provide an environment that is conducive to
positive growth12. Children who are unhealthy and experience barriers to accessing quality healthcare, or
children who are hungry and live in a household where food security is tenuous, are likely to be less ready for
school. Thus indicators such as percentage of children covered by health insurance, percentage of pregnant
mothers accessing appropriate pre-natal care, household income, and percentage of children in poverty are
as relevant to school readiness as basic measures of literacy and numeracy.
44 COMPASS NOW 2015