
Page 55 - 2015 Compass Now
P. 55
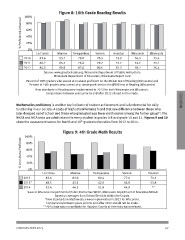
% Proficient & Advanced                           Figure 8: 10th Grade Reading Results

                          100%

                          80%

                          60%

                          40%

                          20%

                          0%                       Monroe Trempealeau Vernon  Houston Wisconsin Minnesota
                                  La Crosse

                          2010   81.6              83.7 78.0 78.5 74.9 76.3 75.4

                          2011   80.2              85.5 76.4 79.7 77.7 74.7 75.1

                          2012   84.3              89.8 82.6 80.6 82.3 78.2 76.4

                                 Source: www.greatschools.org; Wisconsin Department of Public Instruction;
                                          Minnesota Department of Education, Minnesota Report Card

                          Percent of 10th graders who scored at or above proficient on the MCA-II test of Reading (Minnesota) and
                             Percent of 10th graders who scored at or above proficient on the WSAS test of Reading (Wisconsin)

                                 New standards in Reading were implemented in 2013 for both Minnesota and Wisconsin.                   EDUCATION
                                           Comparisons between years prior to and after 2012 should not be made.

Mathematics proficiency is another key indicator of student achievement and is fundamental for daily
functioning in our society. A study of high school females found that one difference between those who
later dropped out of school and those who graduated was lower math scores among the former group14. The
WKCE and MCA tests are administered to every student in grades 4-8 and grade 10 and 11. Figures 9 and 10
show the assessment scores for fourth and 10th grade mathematics from 2012 to 2014.

% At or Above Proficient                             Figure 9: 4th Grade Math Results

                          100%

                          80%

                          60%

                          40%

                          20%

                          0%                       Monroe  Trempealeau                 Vernon               Houston
                                        La Crosse

                          2012         83.4        82.0 80.4 77.6                                                     70.1

                          2013*        48.5        45.5 42.9 45.8                                                     55.8

                          2014         53.4        46.5 51.8 44.9                                                     **

                          Source: Wisconsin Department of Public Instruction WKCE, Minnesota Department of Education MCA-II
                                                     Based on averages from School Districts within the County.

                                           *New standards in Mathematics were implemented in 2013 for Wisconsin.
                                            Comparisons between years prior to and after 2012 should not be made.
                                         **2014 data was not available for Houston County at time data was retrieved.

COMPASS NOW 2015                                                                                                                   47