
Page 48 - 2015 Compass Now
P. 48
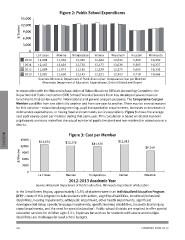
Figure 2: Public School Expenditures

$/Student               15,000
                        12,000
                                  La Crosse   Monroe Trempealeau Vernon    Wisconsin Houston Minnesota
                         9,000
                         6,000    12,008      11,936  12,360  12,660       12,624         9,569                          10,250
                         3,000
                                  12,463      12,455  12,750  13,173       13,020         9,505                          10,237
                               0
                                  11,889      11,973  12,116  12,239       12,375         9,605                          10,336
                           2010
                           2011   12,081      11,650  12,145  12,231       12,343         9,710                          10,666
                           2012
                           2013

                                  Sources: Wisconsin Department of Public Instruction: Comparative Cost per Member;
                                      Minnesota Department of Education: Expenditures, District/State Level Report

In cooperation with the Wisconsin Association of School Business Officials Accounting Committee, the
Department of Public Instruction (DPI) School Financial Services Team has developed several revenue
benchmarks that can be used for informational and general analysis purposes. The Comparative Cost per
Member can differ from one district to another and from one year to another. There may be several reasons
for this variance – educational programming, pupil transportation requirements, increases or decreases in
debt service expenditures, or having food and community service operations. Figure 3 shows the average
cost each county spent per member during that same year. This calculation is based on district resident
pupil counts and does not reflect the actual number of pupils (resident and non-resident) in attendance in a
district.

EDUCATION                                             Figure 3: Cost per Member

              $/Member  15000     $12,632     $12,258         $11,676            $12,813
                        12000
                                                                                                 $9,709
                         9000

                        6000

                        3000

                        0                     Monroe          Trempealeau        Vernon          Houston
                                   La Crosse

                                                      2012-2013 Academic Year

                                  Source: Wisconsin Department of Public Instruction, Minnesota Department of Education

In the Great Rivers Region, approximately 13.8% of students were in an Individualized Education Program
(IEP)5. Users of this program include students with autism, cognitive disabilities, emotional/behavioral
disabilities, hearing impairments, orthopedic impairment, other health impairments, significant
developmental delay, speech/language impairments, specific learning disabilities, traumatic brain injury,
visual impairments, and the need for special education5. Public school districts are required to offer special
education services for children ages 3-21. Expenses for services for students with severe and multiple
disabilities are challenges for local school budgets.

40 COMPASS NOW 2015