
Page 47 - 2015 Compass Now
P. 47
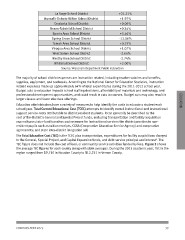
La Farge School District                +21.21%

                  Norwalk-Ontario-Wilton School District  +1.97%

                  Onalaska School District                +0.06%

                  Osseo-Fairchild School District         +0.34%

                  Sparta Area School District             +3.46%

                  Spring Grove School District            -12.00%

                  Tomah Area School District              +0.75%

                  Viroqua Area School District            +1.07%

                  West Salem School District              -2.66%

                  Westby Area School District             -2.74%

                  Whitehall School District               +2.00%

                  Source: Wisconsin Department Public Instruction

The majority of school district expenses are instruction related, including teacher salaries and benefits,       EDUCATION
supplies, equipment, and textbooks. According to the National Center for Education Statistics, instruction
related expenses made up approximately 64% of total expenditures during the 2011-2012 school year.
Budget cuts to education impacts school staffing decisions, affordability of materials and technology, and
professional development opportunities, and could result in cuts to courses. Budget cuts may also result in
larger classes and fewer electives offerings.

Education administrators have a variety of measures to help identify the costs to educate a student each
school year. Total Current Educational Cost (TCEC) attempts to identify overall instructional and instructional
support service costs attributable to district resident students. It can generally be described as the
cost of the district’s General and Special Project funds, excluding transportation and facility acquisition
expenditures; inter-fund transfers and revenues for instructional services the district provides to non-
resident pupils such as tuition receipts, CESA (Cooperative Education Service Agency) and cooperative
agreements; and state inter-district integration aid.

The Total Education Cost (TEC) is the TCEC plus transportation, expenditures for facility acquisitions charged
to the General, Special Project, and Capital Expansion funds, and debt service principal and interest4. The
TEC figure does not include the cost of food, or community service activities funded by fees. Figure 2 shows
the average TEC figures for each county along with state averages. During the 2013 academic year, TEC in the
region ranged from $9,710 in Houston County to $12,231 in Vernon County.

COMPASS NOW 2015                                                   39