
Page 56 - 2015 Compass Now
P. 56
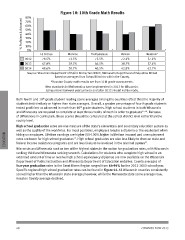
Figure 10: 10th Grade Math Results

           % Proficient & Advanced  80%
                                    70%
                                    60%                      Monroe  Trempealeau  Vernon                         Houston*
                                    50%
                                    40%
                                    30%
                                    20%
                                    10%

                                     0%
                                                  La Crosse

                                    2012  78.5%              73.5%   75.5%        72.3%                          57.4%

                                    2013  47.8%              39.5%   46.5%        38.7%                          57.4%

                                    2014  48.6%              38.7%   40.5%        42.8%                          62.7%

                                    Source: Wisconsin Department of Public Instruction WKCE, Minnesota Department of Education MCA-II
                                                               Based on averages from School Districts within the County.

                                                 *Houston County math results are from 11th grade assessments.

                                          New standards in Mathematics were implemented in 2013 for Wisconsin.
                                          Comparisons between years prior to and after 2012 should not be made.

EDUCATION  Both fourth and 10th grade student reading score averages among the counties reflect that the majority of
           students test similarly or higher than state averages. Overall, a greater percentage of fourth grade students
           tested proficient or advanced in math than 10th grade students. High school students in both Wisconsin
           and Minnesota are required to complete at least three credits of math in order to graduate15,16. Because
           of differences in curriculum, these scores should be compared at the school district level rather than the
           county level.

           High school graduation rates are one measure of the state’s elementary and secondary education system as
           well as the quality of the workforce. For most positions, employers require a diploma or the equivalent when
           hiring an employee. Lifetime earnings are higher (50-100% higher in lifetime income) and unemployment
           rates are lower for high school graduates17. High school graduates are also less likely to draw on state and
           federal income assistance programs and are less likely to be involved in the criminal system17.

           Wisconsin and Minnesota rank as two of the highest states in the nation for graduation rates, with Wisconsin
           ranking third and Minnesota ranking seventh. Calculations for students who complete high school in an
           extended amount of time or receive high school equivalency diplomas are now available on the Wisconsin
           Department of Public Instruction and Minnesota Department of Education websites. County averages of
           four-year graduation rates in the Great Rivers Region ranged from 64-94% for the 2012-2013 school year.
           Specific regional high school graduation rates can be found in Figure 11. All Wisconsin counties consistently
           scored higher than the Wisconsin state average; however, while the Minnesota state score average rose,
           Houston County average declined.

           48 COMPASS NOW 2015