
Page 57 - 2015 Compass Now
P. 57
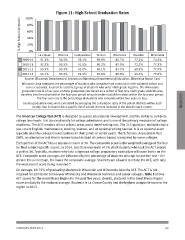
% High School Completion                       Figure 11: High School Graduation Rates

                          100%

                          80%

                          60%

                          40%

                          20%

                          0%                  Monroe Trempealeau Vernon  Wisconsin Houston Minnesota
                                   La Crosse

                          2009-10 91.3%       90.3%  95.1%  89.8%        85.7%          77.2%  74.5%

                          2010-11 92.2%       90.3%  91.5%  90.2%        87.0%          72.3%  77.2%

                          2011-12 95.3%       93.3%  93.0%  96.1%        87.5%          69.5%  77.9%

                          2012-13 94.1%       93.3%  92.4%  91.8%        88.0%          64.7%  79.8%

                          Source: Wisconsin Department of Instruction; Minnesota Department of Education, Minnesota Report Card

                           Wisconsin data compares the percentage of students who complete high school with their adjusted cohort and               EDUCATION
                               earn a credential. A cohort is a distinct group of students who enter ninth grade together. The Minnesota

                          graduation rate is a four-year, on-time graduation rate based on a cohort of first time ninth grade students plus
                          transfers into the cohort within the four year period minus transfers out of the cohort within the four year period.

                                          The four-year rate is the percentage of students who complete within four years or less.

                          County graduation rates were calculated by averaging the completion rates of the school districts within each
                                   county. See Indicators for a specific list of school districts included in the data for each county.

The American College Test (ACT) is designed to assess educational development and the ability to complete
college level work. It is used nationally for college admissions and is one of the primary measures of college
readiness. The ACT consists of four subject areas and a timed writing test. The 215-question, multiple-choice
test covers English, mathematics, reading, science, and an optional writing section. It is an optional exam
typically taken by college-bound students in their junior or senior years. The Scholastic Assessment Test
(SAT), an alternative test that is reason-based instead of content-based, is required by some colleges.

Each portion of the ACT has a maximum score of 36. The composite score is the weighted average of the four
(or five) subject-specific scores. In 2014, less than one-tenth of 1% of all students who took the ACT scored
a perfect 36. Typically, students who take a rigorous college preparatory curriculum will score better on the
ACT. Composite score averages are influenced by the percentage of students who opt to take the test – the
greater the percentage, the lower the composite average. Students are allowed to retake the ACT, with only
the most recent score being recorded18.

On average, 60-79% of graduating students in Wisconsin and Minnesota take the ACT. The ACT is not
required for admission to two-year Minnesota and Wisconsin technical and career colleges. Table 5 shows
ACT scores for the Great Rivers Region for the past five years. Overall, students in the Great Rivers Region
score similarly to the national average. Students in La Crosse County had the highest composite score in the
region in 2013.

COMPASS NOW 2015                                                                                                                                49