
Page 119 - 2015 Compass Now
P. 119
Response to this question varied by education: 43% of those with a college degree stated their community
was excellent, compared to 27% of those with some college or vocational training, and 30% of those with
a high school diploma or less. Responses also varied by income, with a similar pattern – those with higher
income rated their community as a place to live higher than lower income groups.
Aspects of Health
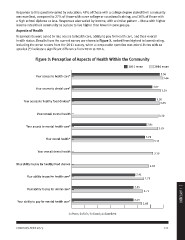
Respondents were asked to rate access to health care, ability to pay for health care, and their overall
health status. Results from the current survey are shown in Figure 3, ranked from highest to lowest rating,
including the mean scores from the 2011 survey, when a comparable question was asked. Items with an
asterisk (*) indicate a significant difference from 2011 to 2014.
Figure 3: Perception of Aspects of Health Within the Community
2011 mean 2014 mean
Your access to health care* 3.36
3.46
Your access to dental care* 3.07
3.39
Your access to healthy food choices* 3.20
3.35
Your overall mental health 3.30
Your access to mental health care*
2.85
Your overal health*
3.29
2.79
3.11
Your overall dental health 3.10
Your ability to pay for healthy food choices 2.94 1 | APPENDIX
Your ability to pay for health care*
Your ability to pay for dental care* 2.41
2.75
Your ability to pay for mental health care*
1=Poor; 2=Fair; 3=Good; 4=Excellent 2.35
2.71
2.35
2.68
COMPASS NOW 2015 111