
Page 115 - 2015 Compass Now
P. 115
Introduction
The COMPASS NOW 2015 community needs assessment included a Random Household Survey to complement
the socioeconomic indicators. The objective of the household survey was to increase the understanding of the
community’s needs and their perceptions of the main challenges facing the region. Results from this survey
were examined by respondent characteristics as well as compared to the previous survey results.
Methods
The COMPASS NOW Random Household Survey was developed and tested by a team of research experts
in 2007. The same survey was used in spring 2011 and again in fall 2014. The 2014 survey was nearly
identical to the 2011 survey to allow for comparisons. The survey included 88 items with questions covering
major areas of community life, including: health, income and the economy, public safety, care giving,
education and lifelong learning, community environment, and community concerns. The majority of the
survey questions asked respondents to rate certain aspects of their community. Each question had a four-
level response scale where1=poor, 2=fair, 3=good, and 4=excellent. There was no undecided, neutral
middle, or a response of ‘I don’t know.’ A ‘does not apply’ response was added to questions pertaining
to education, care giving, and economic aspects, in the event that the respondent could not answer the
question because the situation didn’t apply to them.
The survey was mailed to 5,000 randomly selected households in La Crosse, Monroe, Trempealeau, Vernon,
and Houston Counties, which make up the Great Rivers Region. A mailing service was used to draw the
sample and manage the mailing list. The number of surveys mailed in each county was proportional to
the number of households in the county. The surveys were also sent proportionately to the male head of
household and the female head of household according to the male/female distribution in each county with
a slight oversampling of adults under age 50 and males over age 50 to increase the possible response from
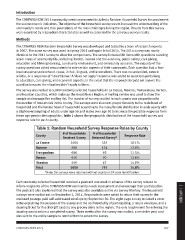
these age-gender demographics. Table 1 shows the geographic distribution of the household survey and
response rate for each county.
Table 1: Random Household Survey Response Rates by County
County # of Households # of Households Response Rate
Received Survey Returned Survey*
La Crosse 2400 435 18.1%
Monroe 900 124 13.8%
Trempealeau 600 69 11.5%
Vernon 650 90 13.8%
Houston 450 67 14.9%
Total 5000 791 15.8%
*Note: Six surveys were returned without county or ZIP code identification.
Each randomly selected household received a postcard one week in advance of the survey release to 1 | APPENDIX
inform recipients of the COMPASS NOW community needs assessment and encourage their participation.
The postcard also explained that the survey was also available online via Survey Monkey. The household
surveys were mailed out on September 2, 2014. Respondents were asked to return their survey in the
enclosed postage-paid self-addressed envelope by September 30. The eight-page survey included a cover
letter explaining the purpose of the survey and the confidentiality of participating, a return envelope, and a
drawing ticket for five $50 gift cards to any grocery store in the region. The only requirement for entering the
drawing was to return a completed survey. Three weeks after the survey was mailed, a reminder post card
was sent to the entire sample to remind them to return the survey.
COMPASS NOW 2015 107