
Page 117 - 2015 Compass Now
P. 117
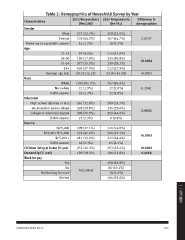
Table 2: Demographics of Household Survey by Year

Characteristics                       2011 Respondents 2014 Respondents   Difference in
                                                                         demographics
                                      (N=1100)     (N=791)

Gender

                    Male 357 (32.5%)               259 (33.0%)

                    Female 729 (66.2%)             507 (64.7%)           0.6727

Prefer not to say/didn’t answer       14 (1.3%)    18 (2.3%)

Age

                    21-35             97 (9.1%)    114 (15.0%)

                    36-50             190 (17.8%)  234 (30.8%)           <0.0001
                    51-64             377 (35.3%)  199 (26.2%)

                    65+ 405 (37.9%)                212 (27.9%)

                  Average age (sd) 59.76 (16.22)   53.94 (15.98)         <0.0001

Race

                    White 1053 (95.7%)             747 (94.4%)

                    Non-white         21 (1.9%)    22 (2.8%)             0.2041

                  Didn’t answer       26 (2.3%)    22 (2.8%)

Education

     High school diploma or less 361 (32.8%)       200 (25.3%)

      Vocational or some college      328 (29.8%)  234 (29.6%)           0.0002
     College or advanced degree       396 (36.0%)  351 (44.4%)

                  Didn’t answer       25 (2.3%)    6 (0.8%)

Income

                    <$25,000 298 (27.1%)           111 (14.0%)

                  $25,001-$75,000     522 (47.4%)  344 (43.5%)           <0.0001
                            $75,001+  211 (19.2%)  272 (34.4%)

                  Didn’t answer       69 (6.3%)    64 (8.1%)

Children living at home (% yes)       253 (24.3%)  253 (32.4%)           <0.0001

Ownership (% rent)                    199 (18.5%)  106 (13.8%)           0.0066

Work for pay

                    Yes 498 (63.9%)

                                 No   Not asked    80 (10.3%)
           No/looking for work                     18 (2.3%)

                    Retired                        184 (23.6%)

                                                                                              1 | APPENDIX

COMPASS NOW 2015                                                                         109