
Page 124 - 2015 Compass Now
P. 124
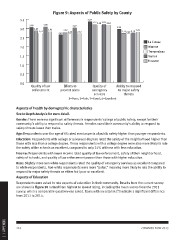
Figure 9: Aspects of Public Safety by County

              3.5                                                     3.37
                                                                            3.22 3.18 3.22 3.18
                   3.05  3.08
                                                          3.02                                   2.95
                                                                                                        2.73 2.69 2.74 2.79
              3.0 2.85 2.82                         2.78        2.72
                                              2.64 2.69
                                        2.72

              2.5

              2.0                                                                                                            La Crosse
                                                                                                                             Monroe
              1.5                                                                                                            Trempealeau
                                                                                                                             Vernon
                                                                                                                             Houston

              1.0

              0.5

              0.0 Quality of law                Efforts to            Quality of                 Ability to respond
                        enforcement           prevent crime           emergency                   to major safety

                                                                      services                   threats

                                              1=Poor; 2=Fair; 3=Good; 4=Excellent

              Aspects of health by demographic characteristics

              See In-Depth Analysis for more detail.

              Gender: There were no significant differences in respondents’ ratings of public safety, except for their
              community’s ability to respond to safety threats. Females rated their community’s ability to respond to
              safety threats lower than males.

              Age: Respondents over the age of 65 rated most aspects of public safety higher than younger respondents.

              Education: Respondents with college or advanced degrees rated the safety of the neighborhood higher than
              those with less than a college degree. Those respondents with a college degree were also more likely to rate
              the safety of the schools as excellent, compared to only 24% of those with less education.

              Income: Respondents with lower income rated quality of law enforcement, safety of their neighborhood,
              safety of schools, and quality of law enforcement poorer than those with higher education.

              Race: Slightly more non-white respondents rated the quality of emergency services as excellent compared
              to white respondents. Non-white respondents were more “polar,” meaning more likely to rate the ability to
              respond to major safety threats as either fair/poor or excellent.

              Aspects of Education

              Respondents were asked to rate aspects of education in their community. Results from the current survey
              are shown in Figure 10 ranked from highest to lowest rating, including the mean scores from the 2011
              survey, when a comparable question was asked. Items with an asterisk (*) indicate a significant difference
              from 2011 to 2014.

1 | APPENDIX  116 COMPASS NOW 2015