
Page 123 - 2015 Compass Now
P. 123
Aspects of Public Safety
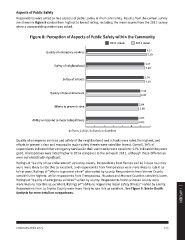
Respondents were asked to rate aspects of public safety in their community. Results from the current survey
are shown in Figure 8 ranked from highest to lowest rating, including the mean scores from the 2011 survey
when a comparable question was asked.
Figure 8: Perception of Aspects of Public Safety within the Community
2011 mean 2014 mean
Quality of emergency services 3.27
3.30
Safety of neighborhood 3.17
3.20
Safety of schools 3.14
3.19
Quality of law enforcement 2.95
2.97
Efforts to prevent crime 2.84
2.88
Ability to respond to major safety threats 2.85
1=Poor; 2=Fair; 3=Good; 4=Excellent 2.85
Quality of emergency services and safety of the neighborhood and schools were rated the highest, and 1 | APPENDIX
efforts to prevent crime and respond to major safety threats were rated the lowest. Overall, 39% of
respondents indicated that emergency services in their community were excellent; 52% indicated they were
good. All responses were rated higher in 2014 compared to the survey in 2011, although these differences
were not statistically significant.
Ratings of “quality of law enforcement” varied by county. Respondents from Vernon and La Crosse counties
were more likely to rate this as excellent, and respondents from Trempealeau were more likely to rate it as
fair or poor. Ratings of “efforts to prevent crime” also varied by county. Respondents from Vernon County
rated this the highest, while respondents from Trempealeau, Houston and Monroe Counties rated this lower.
Ratings of “quality of emergency services” varied by county. Respondents from La Crosse County were
more likely to rate this as excellent. Ratings of “ability to respond to major safety threats” varied by county.
Respondents from La Crosse County were more likely to rate this as excellent. See Figure 9. See In-Depth
Analysis for more detail on comparisons.
COMPASS NOW 2015 115