
Page 92 - 2015 Compass Now
P. 92
How healthy do we think we are we?
In the COMPASS NOW 2015 Random Household Survey, residents of the Great Rivers Region indicated their
perception of the overall health of their community for both COMPASS NOW 2012 and COMPASS NOW 2015
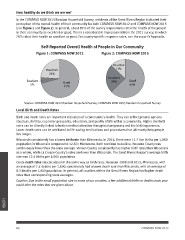
(see Figure 1 and Figure 2). In general, about 87% of the survey respondents rated the health of the people
in their community as excellent or good. This is a considerable improvement from the 2011 survey, in which
76% rated their health as excellent or good. For county-specific response rates, see the report’s Appendix.
Self-Reported Overall Health of People in Our Community
Figure 1: COMPASS NOW 2012 Figure 2: COMPASS NOW 2015
Poor/Fair Poor/Fair
24% 13%
Excellent Good Excellent Good
5% 71% 24% 63%
Source: COMPASS NOW 2012 Random Household Survey, COMPASS NOW 2015 Random Household Survey
Local Birth and Death Rates
Birth and death rates are important indicators of a community’s health. They can reflect general age-sex
structure, fertility, economic prosperity, education, and quality of life within a community. Higher live birth
rates can be directly linked to better medical attention throughout pregnancy and the birthing process.
Lower death rates can be attributed to life-saving medications and procedures that ultimately help people
live longer.
Wisconsin consistently has a lower birth rate than Minnesota. In 2014, there were 11.7 live births per 1,000
population in Wisconsin compared to 12.8 in Minnesota. Both continue to decline. Houston County was
continuously lower than the state average. Vernon County consistently has higher birth rates than Wisconsin
as a whole, while La Crosse County’s rates are lower than Wisconsin. The Great Rivers Region’s average birth
rate was 12.4 births per 1,000 population.
Crude death rates are calculated in the same way as birth rates. Between 2008 and 2013, Minnesota, with
an average of 7.4 deaths per 1,000, consistently had a lower death rate than Wisconsin, with an average of
8.3 deaths per 1,000 population. In general, all counties within the Great Rivers Region had higher death
rates than corresponding state averages.
Caution: Due to the small population size in some of our counties, a few additional births or deaths each year
could alter the rates that are given above.
HEALTH
84 COMPASS NOW 2015