Page 125 - 2015 Compass Now
P. 125

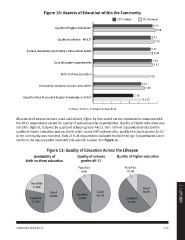
Figure 10: Aspects of Education within the Community

                                                                      2011 mean  2014 mean

                  Quality of higher education*                                          3.23
                                                                                           3.38

                         Quality of schools - 4K-12*                                    3.13
                                                                                           3.28

A place that meets your family’s educational needs                                      3.12
                                                                                          3.26

                  Early education opportunities                                         3.19
                                                                                         3.23

                                     Birth-to-three education                                    3.00
               Community resources to learn new skills*
Opportunities in your job to gain knowledge or skills*                                   2.61
                                                                                             2.80

                                                                                 2.18
                                                                                            2.75

                          1=Poor; 2=Fair; 3=Good; 4=Excellent

All aspects of education were rated statistically higher by the current survey respondents compared with
the 2011 respondents except for quality of early education opportunities. Quality of higher education was
rated the highest, followed by quality of schools grades 4K-12. Over 50% of respondents indicated the
quality of higher education was excellent, while nearly 40% indicated the quality of schools grades 4k-12
in the community was excellent. Only 21% of respondents indicated that birth to age 3 opportunities were
excellent. An equal number indicated this was fair or poor. See Figure 11.

                  Figure 11: Quality of Education Across the Lifespan

      Availability of     Quality of schools                          Quality of higher education
birth-to-three education    grades 4K-12

                          Poor/Fair                                   Poor/Fair
                            9.8%                                       10.3%

Poor/Fair         Good    Excellent                            Good              Good                       1 | APPENDIX
  21.6%           50.9%    39.8%                               50.4%             38.2%

Excellent                                                             Excellent
 27.5%                                                                 51.5%

COMPASS NOW 2015                                                                                       117
   120   121   122   123   124   125   126   127   128   129   130