
Page 76 - 2015 Compass Now
P. 76
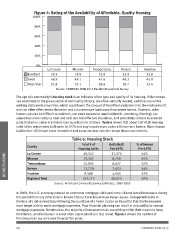
Figure 4: Rating of the Availability of Affordable, Quality Housing

                 100%

                 80%

                 60%

                 40%

                 20%

                         0%      La Crosse  Monroe         Trempealeau         Vernon    Houston
                                                                                           32.8
                 Excellent       29.3 19.8 23.8 23.0                                       43.8
                 Good                                                                      23.4
                 Poor/Fair       48.9 49.1 47.6 48.3

                                 21.8 31.1 28.6 28.7

                                 Source: COMPASS NOW 2015 Random Household Survey

                 The age of a community’s housing stock is an indicator of the type and quality of its housing. Older homes
                 can contribute to the preservation of community history, are often centrally located, and thus are within
                 walking distance to amenities, which could lower the amount of fossil fuel emissions into the environment8,
                 and can often offer certain character and a more mature landscape than newer homes. However, older
                 homes can also be difficult to maintain, can need expensive repairs (electric, plumbing, flooring), are
                 sometimes more costly to heat and cool due to ineffective insulation, and potentially contain lead-based
                 paint that when eaten or inhaled can cause harm to children. Table 6 shows that about half of all housing
                 units in the region were built prior to 1970 and may require more upkeep than newer homes. Many homes
                 built before 1970 have been remodeled and some are now in better shape than newer homes.

                                            Table 6: Housing Stock

                 County                        Total # of   Units Built                  % of Homes
                                            Housing Units   Pre-1970                      Pre-1970
                 La Crosse                                                                   44%
INCOME/ECONOMIC  Monroe                             48,542              21,570               45%
                 Trempealeau                                                                 52%
                 Vernon                             19,267              8,700                54%
                 Houston                                                                     53%
                 Regional Total                     12,655              6,627                48%

                                                    13,720              7,413

                                                    8,588               4,545

                                            102,772                     48,855

                                 Source: American Community Survey Estimates, 2009-2013

                 In 2008, the U.S. economy entered an enormous mortgage crisis and more citizens faced foreclosure during
                 this period than any other time in known history. Foreclosure have many causes. Unexpected debts or
                 the loss of a job immediately following the purchase of a home can be so impactful that the homeowner
                 is no longer able to make mortgage payments. Poor financial planning can result in an inability to sustain
                 mortgage payments. Nonetheless, the majority of homeowners do everything within their means to keep
                 their home, and foreclosure is most often approached as a last resort. Figure 5 shows the number of
                 foreclosures in our area over the past five years.

                 68 COMPASS NOW 2015