
Page 74 - 2015 Compass Now
P. 74
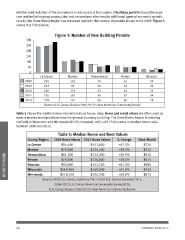
Another lead indicator of the economy in a community is the number of building permits issued because
                 new residential housing construction and renovations often lead to additional types of economic growth.
                 Locally, the Great Rivers Region has remained stable in the number of permits issued since 2009. Figure 3
                 shows this information.

                                     Figure 3: Number of New Building Permits

                  300     La Crosse  Monroe    Trempealeau  Vernon                                      Houston
                  250                                                                                      28
                  200       234 102            75           61                                             33
                  150                                                                                      21
                  100       223 97 76 63                                                                   34
                                                                                                           28
                   50       240 116            51           44
                     0
                            255 90 54 52
                 2009
                 2010       278 101            65           50
                 2011
                 2012
                 2013

                            Source: U.S. Census Bureau 2009-2013 5-Year American Community Survey

                 Table 3 shows the median home and rental values for our area. Home and rental values are often used as
                 measurements to help indicate how the general economy is fairing. The Great Rivers Region is trending
                 similarly to Wisconsin and Minnesota (62.9% increase), with a 60.1% increase in median home value
                 between 2000 and 2012.

                                     Table 3: Median Home and Rent Values

                 County/Region 2000 Home Values 2012 Home Values % Change Rent/Month

                 La Crosse           $94,400   $153,600     +61.5%                                      $726

                 Monroe              $79,300   $134,400     +59.0%                                      $743

INCOME/ECONOMIC  Trempealeau         $81,200   $133,300     +60.9%                                      $618

                 Vernon              $79,300   $136,800     +58.0%                                      $615

                 Houston             $92,600   $151,100     +61.3%                                      $585

                 Wisconsin           $109,900  $169,000     +65.0%                                      $759

                 Minnesota           $118,100  $194,300     +60.8%                                      $819

                            Source: 2000 U.S. Census, Summary File 3; 2010 U.S. Census Summary File 1;

                                     2008-2012 U.S. Census American Community Survey (ACS),

                              U.S. Census Bureau 2009-2013 5-Year American Community Survey

                 66 COMPASS NOW 2015