
Page 46 - 2015 Compass Now
P. 46
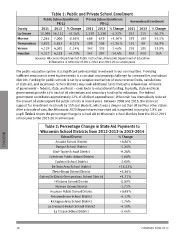
Table 1: Public and Private School Enrollment

                      Public School Enrollment  Private School Enrollment  Homeschool Enrollment
                                  PK-12                     PK-12

           County     2011 2013 % Change 2011 2013 % Change 2011 2013 % Change

           La Crosse  16,098 16,152 +0.34% 2,339 2,238 -4.32% 337 215 -36.2%

           Monroe     7,046 7,006 -0.56% 668 678 +1.50% 293 189 -35.5%

           Trempealeau 5,832 5,825 -0.12% 298 302 +1.34 % 152 99                                              -34.9%

           Vernon     4,129 4,082 -1.14% 343 338 -1.46% 276 185 -33.0%

           Houston    4,317 4,521 +4.73% 347 297 -14.4% N/A N/A                                               N/A

                      Sources: Wisconsin Department of Public Instruction, Minnesota Department of Education
                                    Information is reflective of 2011-2012 and 2013-2014 school years

           The public education system is a significant and essential investment in our communities. Providing
           sufficient resources to meet student needs is a constant and growing challenge for communities and school
           districts. Funding for public schools is set by a complex mechanism of state revenue limits, calculations
           of state aid, and local taxes. School districts may seek additional funds through a referendum. All levels
           of government – federal, state, and local – contribute to educational funding. Typically, state and local
           governments provide 44% each of all elementary and secondary funding for education. The federal
           government contributes approximately 12% of all direct expenditures3. Wisconsin has dramatically reduced
           the amount of state support for public schools in recent years. Between 2008 and 2015, the state cut
           support for investment in schools by 15% per student, which was a deeper cut than all but four other states.
           After a decade of cuts, the Minnesota 2020 Report shares how state aid is expected to jump by 7.8% per
           pupil. Table 2 shows the percentage change in school aid to Wisconsin school districts from the 2012-2013
           school year to the 2013-2014 school year.

EDUCATION                Table 2: Percentage Change in State Aid Payments to
                      Wisconsin School Districts from 2012-2013 to 2013-2014

                      School District                                 % Change

                      Arcadia School District                         +6.86%

                      Bangor School District                          -1.26%

                      Blair-Taylor School District                    -9.28%

                      Caledonia Public School District                -1.68%

                      Cashton School District                         -2.00%

                      De Soto Area School District                    +16.23%

                      Eleva-Strum School District                     +6.36%

                      Galesville-Ettrick-Trempealeau School District  +1.71%

                      Hillsboro School District                       -0.89%

                      Holmen School District                          -1.72%

                      Houston Public School District                  +0.89%

                      Independence School District                    -4.12%

                      Kickapoo Area School District                   -1.76%

                      La Crescent-Hokah School District               -4.11%

                      La Crosse School District                       -5.45%

           38 COMPASS NOW 2015