
Page 30 - 2015 Compass Now
P. 30
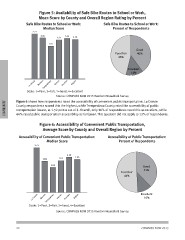
Figure 5: Availability of Safe Bike Routes to School or Work,
Mean Score by County and Overall Region Rating by Percent

Safe Bike Routes to School or Work:                                                                      Safe Bike Routes to School or Work:
              Median Score                                                                                      Percent of Respondents

         2.71

2.46        2.35 2.43 2.38

      1.97

                                                                                                         Poor/Fair  Good
                                                                                                           46%      40%

                                                                                                                    Excellent
                                                                                                                      14%

COMMUNITY
                                    La Crosse
                                                 TrempMeoalneraoue
                                                                         Vernon
                                                                                   Houston
                                                                                                 Region
          Scale: 1=Poor, 2=Fair, 3=Good, 4=Excellent

                                       Source: COMPASS NOW 2015 Random Household Survey

Figure 6 shows how respondents rated the accessibility of convenient public transportation. La Crosse
County respondents scored this the highest, while Trempealeau County rated the accessibility of public
transportation lowest, at 1.52 points out of 4. Overall, only 10% of respondents rated this as excellent, while
44% rated public transportation accessibility as fair/poor. This question did not apply to 13% of respondents.

Figure 6: Accessibility of Convenient Public Transportation,
  Average Score by County and Overall Region by Percent

Accessibility of Convenient Public Transportation:                                                       Accessibility of Public Transportation:
                       Median Score                                                                               Percent of Respondents

                      2.71

                  2.13  2.00

1.89        1.93

      1.52                                                                                                                     Good
                                                                                                                               33%
                                                                                                         Poor/Fair
                                                                                                           44%

La Crosse                                                                                                                      Excellent
             TrempMeoalneraoue                                                                                                   10%

                                     Vernon
                                               Houston
                                                             Region

Scale: 1=Poor, 2=Fair, 3=Good, 4=Excellent
                           Source: COMPASS NOW 2015 Random Household Survey

22 COMPASS NOW 2015