
Page 153 - 2015 Compass Now
P. 153
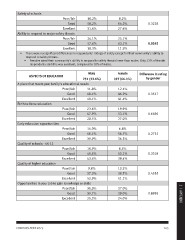
Safety of schools

                               Poor/fair    10.2%        8.2%

                               Good         58.2%        64.2%        0.3228

                               Excellent    31.6%        27.6%

Ability to respond to major safety threats

                               Poor/fair    24.1%        25.1%

                               Good         57.6%        63.1%        0.0345

                               Excellent    18.3%        11.8%

•	 There were no significant differences in respondents’ ratings of safety except for their community’s ability to
     respond to safety threats.
    •	 Females rated their community’s ability to respond to safety threats lower than males. Only 12% of female
         respondents said this was excellent, compared to 18% of males.

ASPECTS OF EDUCATION                            Male        Female    Difference in rating
                                            251 (33.6%)  497 (66.4%)       by gender
                                                                             0.3517
A place that meets your family’s educational needs          12.4%
                                                            46.2%            0.6696
                               Poor/fair    11.8%           41.4%
                                                                             0.2752
                               Good         48.1%           19.9%
                                                            53.1%            0.3318
                               Excellent    40.1%           27.0%
                                                                             0.4555
Birth-to-three education                                     6.8%
                                                            56.7%            0.8895
                               Poor/fair    23.6%           36.5%

                               Good         47.9%            8.5%
                                                            53.1%
                               Excellent    28.5%           38.4%

Early education opportunities                               10.2%
                                                            38.7%
                               Poor/fair    14.0%           51.1%

                               Good         46.1%           37.0%
                                                            39.0%
                               Excellent    39.9%           24.0%

Quality of schools - 4K-12

                               Poor/fair    10.9%

                               Good         45.5%

                               Excellent    43.6%

Quality of higher education

                               Poor/fair    9.8%

                               Good         37.3%

                               Excellent    52.9%

Opportunities in your job to gain knowledge or skills                                                               2 | APPENDIX

                               Poor/fair    35.0%

                               Good         39.7%

                               Excellent    25.3%

COMPASS NOW 2015                                                              145