
Page 152 - 2015 Compass Now
P. 152
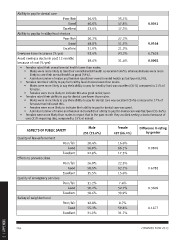
Ability to pay for dental care

                                              Poor/fair  36.5%        35.1%

                                               Good      40.0%        47.6%        0.0341

                                              Excellent  23.5%        17.3%

              Ability to pay for healthy food choices

                                              Poor/fair  20.2%        27.2%

                                               Good      48.8%        51.5%        0.0164

                                              Excellent  31.0%        21.3%

              Everyone have insurance (% yes)            92.6%        93.2%        0.7618

              Avoid seeing a doctor in past 12 months    18.6%        31.4%        0.0002
              because of cost (% yes)

              •	 Females rated their overall mental health lower than males.
                  •	 Males were more likely to rate their overall mental health as excellent (46%), whereas females were more
                       likely to rate their mental health as good (59%).
                  •	 A similar number of males and females rated their overall mental health as fair/poor (6.5%).

              •	 Females rate their ability to pay for healthy food choices lower than males.
                  •	 Males were more likely to say their ability to pay for healthy food was excellent (31%) compared to 21% of
                       females.
                  •	 Females were more likely to indicate this was good or fair/poor.

              •	 Females rated their ability to pay for dental care lower than males.
                  •	 Males were more likely to say their ability to pay for dental care was excellent (24%) compared to 17% of
                       females that indicated this.
                  •	 Females were more likely to indicate their ability to pay for dental care was good.
                  •	 A similar number of males and females indicated their ability to pay for dental care was fair/poor (35-36%).

              •	 Females were more likely than males to report that in the past month they avoided seeing a doctor because of
                   cost (31% reporting this, compared to 19% of males).

              ASPECTS OF PUBLIC SAFETY                       Male        Female    Difference in rating
                                                         251 (33.6%)  497 (66.4%)       by gender
              Quality of law enforcement      Poor/fair                                   0.0876
              Efforts to prevent crime            Good      20.4%        16.6%
              Quality of emergency services                 56.8%        66.1%            0.6782
              Safety of neighborhood          Excellent     22.8%        17.3%
                                                                                          0.3609
                                              Poor/fair     26.0%        22.3%
                                                  Good      58.5%        62.1%            0.1477
                                                            15.5%        15.6%
                                              Excellent
                                                            11.2%         7.4%
                                              Poor/fair     50.2%        52.7%
                                                  Good      38.6%        39.9%

                                              Excellent     12.8%         8.7%
                                                            55.3%        59.6%
                                              Poor/fair     31.9%        31.7%
                                                  Good

                                              Excellent

2 | APPENDIX  144 COMPASS NOW 2015