
Page 65 - 2015 Compass Now
P. 65
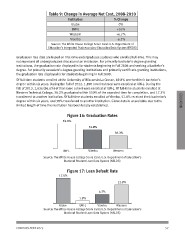
Table 9: Change in Average Net Cost, 2008-2010

                         Institution                 % Change

                         Globe                       0%

                         UW-L                        +10%

                         Western                     +6.7%

                         Viterbo                     -6.2%

                    Source: The White House College Score Card: U.S. Department of
                  Education’s Integrated Postsecondary Education Data System (IPEDS)

Graduation rate data are based on first-time undergraduate students who enrolled full-time. This may             EDUCATION
not represent all undergraduates that attend an institution. For primarily bachelor’s degree-granting
institutions, the graduation rate displayed is for students beginning in Fall 2006 and seeking a bachelor’s
degree. For primarily associate’s degree-granting institutions and primarily certificate-granting institutions,
the graduation rate displayed is for students beginning in Fall 2009.

Of full-time students enrolled at the University of Wisconsin-La Crosse, 69.8% received their bachelor’s
degree within six years. During the Fall of 2012, 1,890 new freshmen were enrolled at UW-L. During the
Fall of 2013, 1,636 (86.6%) of that same cohort were enrolled at UW-L. Of full-time students enrolled at
Western Technical College, 36.3% graduated within 150% of the expected time for completion, and 17.3%
transferred to another institution. Of full-time students enrolled at Viterbo, 52.8% received their bachelor’s
degree within six years, and 38% transferred to another institution. Globe data is unavailable due to the
limited length of time the institution has been locally established.

                     Figure 16: Graduation Rates

                  69.8%

                                           52.8%
                                                                      36.3%

                  UW-L                Viterbo        Western

                  Source: The White House College Score Card: U.S. Department of Education’s
                                      National Student Loan Data System (NSLDS)

                       Figure 17: Loan Default Rate

                  17.5%

                                                                            12.9%

                                               6.3%

                               1.8%

                  Globe        UW-L   Viterbo        Western

                  Source: The White House College Score Card: U.S. Department of Education’s

                  National Student Loan Data System (NSLDS)

COMPASS NOW 2015                                                                              57