Page 145 - 2015 Compass Now
P. 145

Quality of higher education

Poor/fair 2.3%                  24.5%                  18.3%  24.3%                  14.0%

Good 32.7%                      47.2%                  50.0%  43.2%                  40.4%    <.0001

Excellent 65.0%                 28.3%                  31.7%  32.4%                  45.6%

Mean Score        3.62                   2.99          3.05   3.03                   3.23     <.0001

Opportunities in your job to gain knowledge or skills

Poor/fair 30.1%                 50.6%                  42.9%  49.2%                  36.2%

Good 39.8%                      34.5%                  40.8%  39.3%                  38.3%    0.0003

Excellent 30.1%                 14.9%                  16.3%  11.5%                  25.5%

Mean Score        2.90                   2.44          2.71   2.43                   2.74     <.0001

Community resources to learn new skills

Poor/fair 21.8%                 52.6%                  64.1%  49.4%                  24.2%

Good 48.6%                      34.2%                  23.4%  36.7%                  46.8%    <.0001

Excellent 29.5%                 13.2%                  12.5%  13.9%                  29.0%

Mean Score        3.03                   2.47          2.20 2.48 2.95 <.0001

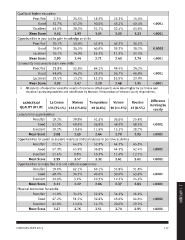
•	 All aspects of education varied by county of residence. Most aspects were rated higher by La Crosse and
     Houston County respondents and rated lower by Monroe, Trempealeau or Vernon County respondents.

ASPECTS OF        La Crosse     Monroe Trempealeau Vernon                            Houston  Difference
                                                                                              in rating by
QUALITY OF LIFE 435 (55.4%) 124 (15.8%) 69 (8.8%) 90 (11.5%) 67 (8.5%)
                                                                                                 county
Leisure time opportunities
                                                                                                <.0001
Poor/fair 19.2%                 39.8%                  51.5%  35.6%                  25.8%      <.0001
                                                                                     48.5%
Good 51.5%                      49.6%                  36.8%  48.9%                  28.7%      <.0001
                                                                                      2.95      <.0001
Excellent 29.3%                 10.6%                  11.8%  15.5%
                                                                                     45.5%      <.0001
Mean Score        3.08                   2.65          2.44 2.70                     42.4%      <.0001
                                                                                     12.1%
Opportunities for youth to explore interests and participate in positive activities   2.61      <.0001
                                                                                                <.0001
Poor/fair 21.1%                 44.3%                  52.9%  44.3%                  31.8%
                                                                                     43.9%
Good 57.3%                      45.9%                  36.8%  44.3%                  24.2%
                                                                                      2.83
Excellent 21.6%                 9.8%                   10.3%  11.4%
                                                                                     26.2%
Mean Score        2.99                   2.57          2.32 2.61                     44.6%
                                                                                     29.2%
Opportunities to enjoy fine arts and cultural experiences                             2.95

Poor/fair 19.0%                 62.1%                  69.1%  57.8%

Good 48.2%                      34.7%                  20.6%  30.0%

Excellent 32.9%                 3.2%                   10.3%  12.2%

Mean Score        3.11                   2.22          2.06 2.37                                                 2 | APPENDIX

Physical recreation for adults

Poor/fair 11.8%                 34.2%                  52.9%  34.4%

Good 47.2%                      51.2%                  32.4%  45.6%

Excellent 41.0%                 14.6%                  14.7%  20.0%

Mean Score        3.27                   2.76          2.51 2.74

COMPASS NOW 2015                                                                                            137
   140   141   142   143   144   145   146   147   148   149   150