
Page 108 - 2015 Compass Now
P. 108
With the enactment of the Affordable Care Act, millions of previously uninsured individuals have gained
insurance coverage by purchasing private insurance packages or receiving Medicaid. According to the Kaiser
Family Foundation, some key points from the implementation of the ACA are:
• On average, an uninsured person will incur considerably lower medical expenses than someone who
is insured for the full year. In 2013, the average uninsured person had half the amount of medical
expenditures as the average insured person ($2,443 versus $4,876)23.
• In 2013, the cost of “uncompensated care” provided to uninsured individuals was $84.9 billion.
Uncompensated care includes health care services without a direct source of payment. In addition,
people who are uninsured paid an additional $25.8 billion out-of-pocket for their care23.
• The majority of uncompensated care (60%) is provided in hospitals. Community based providers
(including clinics and health centers) and office-based physicians provide the rest, providing 26% and
14% of uncompensated care, respectively23.
• In 2013, $53.3 billion was paid to help providers offset uncompensated care costs. Most of these
funds ($32.8 billion) came from the federal government through a variety of programs, including
Medicaid and Medicare, the Veterans Health Administration, and other programs. States and localities
provided $19.8 billion, and the private sector provided $0.7 billion23.
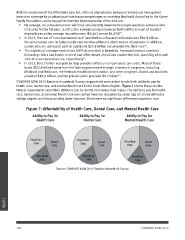
COMPASS NOW 2015 Random Household Survey respondents were asked to rate their ability to pay for
health care, dental care, and mental health care in the Great Rivers Region. Figure 7 shows these results.
Female respondents rated their ability to pay for dental care worse than males. The ability to pay for health
care, dental care, and mental health care was ranked lower by respondents under age 65, those without a
college degree, and those earning lower incomes. There were no significant differences based on race.
Figure 7: Affordability of Health Care, Dental Care, and Mental Health Care
Ability to Pay for Ability to Pay for Ability to Pay for
Health Care Dental Care Mental Health Care
Poor/Fair Good Poor/Fair Good Poor/Fair Good
36% 44% 36% 45% 39% 43%
Excellent Excellent Excellent
20% 19% 18%
Source: COMPASS NOW 2015 Random Household Survey
HEALTH
100 COMPASS NOW 2015